


Industrial Space Demand Forecast, Third Quarter 2018
Release Date: August 2018
Robust Economy Means Increased Industrial Demand
The forecast for demand for industrial space has risen because of increased expectations of broad macroeconomic growth and job generation for the remainder of 2018 and 2019. According to Dr. Hany Guirguis of Manhattan College and Dr. Joshua Harris of New York University, quarterly net absorption is expected to increase to an average of 60 million square feet for the latter half of 2018 and then moderate to 56 million square feet per quarter in 2019.
Advance indications for gross domestic product (GDP) growth for the rest of 2018 show consensus forecasts approaching annualized growth of 4.0 percent for the second quarter, which could result in sustained growth of 3.0 percent or more for the rest of the year and into 2019. Higher oil prices are a leading cause of increased business investment because as oil prices rise, there is more incentive to increase energy production and commence energy exploration – activities that significantly stimulate the overall economy. Another major force at play is consumer spending, as e-commerce continues to generate demand for industrial space.
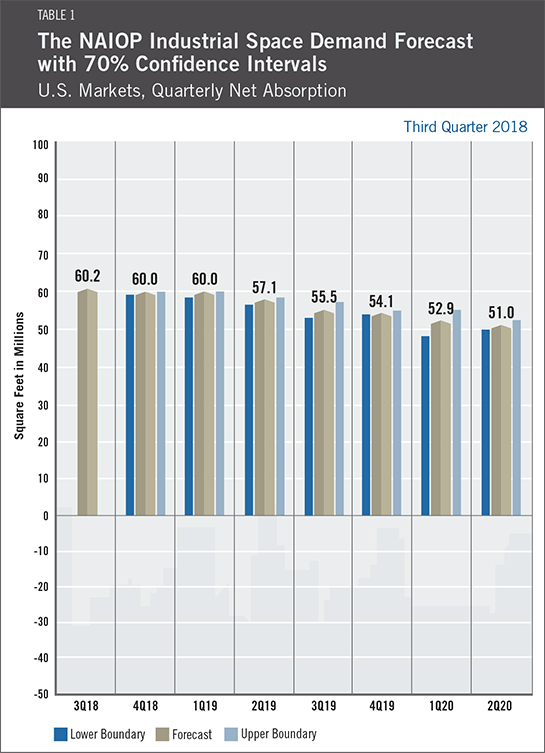
In 2017 quarterly completions averaged 54 million square feet, which closely matched expected and actual demand, but just 45 million square feet per quarter have been delivered to date in 2018. This gap contributed to the vacancy rate falling to 7.2 percent at the end of 2018’s second quarter from 7.4 percent at the end of 2017. Without increased construction of industrial space, market fundamentals such as rents and occupancy rates will only rise on the basis of demand predictions for the rest of 2018 and all of 2019.
The vast majority of economic indicators are showing positive growth and indicating such growth should continue for at least the next year and a half, if not longer. Indicators with a clear predictive link to industrial space demand are also very strong; the Institute for Supply Management’s Purchasing Managers Index continues to improve, with a reading of 60.2 as of June 2018 (any reading above 50 indicates growth or positive expectations). Additionally, most subcomponents of the Index are in positive growth territory as well.
As such, the industrial market should see continued growth from retail sales that are linked to e-commerce distribution, but also from increased manufacturing activity, including production of large durable goods and small goods as well as assembly of packaged food items. According to the Institute for Supply Management, the overall manufacturing sector has grown for 22 months, registering one of the longest sustained growth periods for some time in the U.S. Growth in this area benefits light manufacturing, assembly and even large-scale factories, and it also supports other components of the manufacturing supply chain such as warehouses and transport.
The biggest risk to the economy and the industrial real estate sector remains the threat of rising interest rates. At this writing, the yield curve (the difference between long-term and short-term U.S. Treasury rates) has been flattening as the Board of Governors of the Federal Reserve System adjusts its short-term interest rate policy. So far, there has been no inversion where short-term yields are higher than long-term yields, yet risks relating to increases in short-term interest rates are palpable because the economy has been in expansion for more than nine years. Eventually, the U.S. will experience some form of a contraction, but at this moment, it appears to be more than two years away.
Key Inputs and Disclaimers
The predictive model is funded by the NAIOP Research Foundation and was developed by Guirguis and Dr. Randy Anderson, formerly of the University of Central Florida. The model, which forecasts demand for industrial space at the national level, utilizes variables that comprise the entire supply chain and lead the demand for space, resulting in a model that is able to capture the majority of changes in demand.
While leading economic indicators have been able to forecast recessions and expansions, the indices used in this study are constructed to forecast industrial real estate demand expansions, peaks, declines and troughs. The Industrial Space Demand model was developed using the Kalman filter approach, where the regression parameters are allowed to vary with time and thus are more appropriate for an unstable industrial real estate market.
The forecast is based on a process that involves testing more than 40 economic and real estate variables that theoretically relate to demand for industrial space, including varying measures of employment, GDP, exports and imports, and air, rail and shipping data. Leading indicators that factor heavily into the model include the Federal Reserve Board’s Index of Manufacturing Output (IMO), the Purchasing Managers Index (PMI) from the Institute of Supply Management (ISM) and net absorption data from CBRE Econometric Advisors.
ISM, the Federal Reserve and CBRE Econometric Advisors assume no responsibility for the Forecast. The absorption forecast tracks with CBRE data and may vary when compared with other data sets. Data includes warehouse, distribution, manufacturing, R&D and special purpose facilities with rentable building areas of 10,000 square feet or more.
Actual Versus Forecast
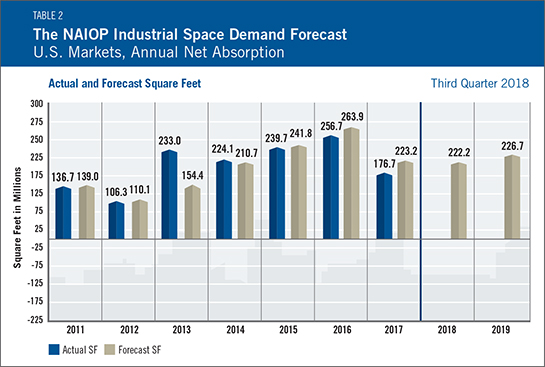
The industrial market underperformed slightly compared with previous forecasts in the first half of 2018; 105 million square feet were actually absorbed versus 113 million square feet forecast. This slight drift was likely due to two factors. First, actual GDP growth for the first quarter was just 2.0 percent with previous expectations targeting 3.0 percent. Second, the industrial space market delivered less square footage per quarter in the first half of 2018 than it did in the same period of 2017, despite all indications of rising net demand.
Initial and Ongoing Research
In 2009, the NAIOP Research Foundation awarded a research grant to Anderson and Guirguis to develop a model for forecasting net absorption of industrial space in the United States. That model led to successful forecasting two quarters out. A white paper describing the research and testing behind the model for NAIOP’s Industrial Space Demand Forecast is available.
The model was revised in 2012 to forecast eight quarters out. For this longer term forecast, Guirguis and Harris utilize the average central tendency forecast of the unemployment rate and growth rate of real GDP, provided by the seven members of the Board of Governors and the 12 presidents of the Federal Reserve Banks during the most recent Federal Open Market Committee meeting. Their forecasts are the independent variables in the equations. The forecasts usually vary from one year to another, so different techniques are applied to convert the yearly forecast to a quarterly one, in order to create the quarterly forecasts for net absorption. The estimated coefficients on the independent variables are estimated with the time-varying Kalman filter.