


Office Space Demand Forecast, Fourth Quarter 2020
Release Date: November 2020
Economic Trends
 COVID-19 remains a drag on the U.S. economy. In reaction to the pandemic, the Federal Reserve Open Market Committee lowered policy rates back to zero and increased the size of the Fed’s balance sheet to nearly $7 trillion with unprecedented intervention in financial markets. Earlier in the year, the federal government passed two rounds of fiscal stimulus, totaling nearly $3 trillion in potential obligations. It remains unclear how the results of the congressional and presidential elections will affect federal economic policy in the coming year.
Macroeconomic signals have diverged. Real U.S. gross domestic product (GDP) grew negligibly in Q1 2020, reflecting existing economic stress. It then contracted by 9% in Q2 2020, one of the largest quarterly economic contractions on record.1 About two-thirds of the second quarter’s decline in GDP was erased in the third quarter, which saw GDP growth at an annualized rate of 33.1%.2 However, the economy remains in a severe recession.
First-time unemployment insurance claims remain elevated at approximately 700,000 per week.3 During the first three quarters of 2020, nearly 76 million individuals filed a first-time claim for unemployment insurance. Job losses have been concentrated in retail and leisure sectors and among young workers.4 The civilian labor force participation rate for prime-age individuals, aged 25 to 54, has fallen to approximately 62%, a level not seen since the late 1970s.5
The 10-year U.S. Treasury, an important economic bellwether, remains at historic lows. The yield curve, measured as the difference between the 10-year and 3-month U.S. Treasuries, has been flat or negative for 18 months. As a measure of market expectations for future growth, it currently stands at approximately 80 basis points (bps). Market expectations of long-term inflation, as measured by the 10-year breakeven inflation rate, remain approximately 50 bps below the Fed’s stated inflation target of 2%.6 In contrast, equity markets, measured by broad indices such as the Wilshire 5000, have largely recovered to pre-COVID levels. Equity market volatility, as measured by the VIX, has receded considerably since March.7
Effects on Demand for Office Space
The coronavirus pandemic has led to conditions that are remarkably different from past recessions but are nonetheless challenging for the office sector. The largest office-using industries have been more insulated from the effects of the pandemic than the economy as a whole. October unemployment rates in the financial-activities sector (3.8%), information sector (5.8%) and professional and business services sector (6.1%) were below the U.S. national average of 6.9%.8 However, these sectors have been less affected than others in part because of their ability to transition to remote-work arrangements, a trend that has diminished demand for office space.
In response to safety concerns, many firms are allowing their employees to work remotely on a full-time basis and appear likely to continue this practice until COVID-19 is no longer a significant health risk. As of September, only about 25% of workers across the U.S. had returned to their offices.9 Multiyear lease terms have mitigated the effects of reduced occupancy on vacancy rates, which have increased from 12.3% in the first quarter of 2020 to 14.0% in the third quarter, according to data provided by CBRE. Vacancy rates are likely to continue to rise through the end of 2020 as more leases come up for renewal.
The Forecast
The model that informs this forecast draws from historical data on the economy and office real estate absorption to project future demand. Since global pandemics are very rare, current economic conditions are not easily comparable with most periods for which data are available. For this reason, the unique ways that COVID-19 may affect demand for office space are difficult to forecast in a predictive model. Nonetheless, recent trends in office absorption suggest that office sector performance will continue to reflect economic conditions, as in past economic cycles.
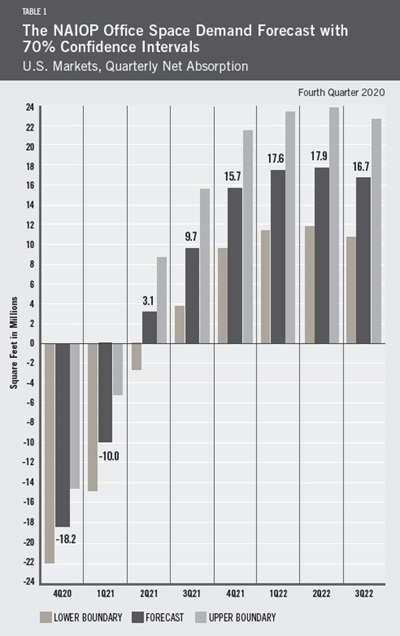
Given the continued challenges facing the U.S. economy, office net absorption is forecast to be negative 18 million square feet in Q4 2020 and negative 10 million square feet in Q1 2021, a deterioration from the prior office demand forecast. CBRE data reveal that office net absorption was slowing well before the impact of COVID-19, reflecting existing stress in the U.S. economy. According to CBRE, office net absorption contracted by a total of 50.7 million square feet in the first three quarters of 2020. Combined with the negative absorption forecast for Q4 2020 and Q1 2021, the contraction of office net absorption will likely be more severe than the contraction experienced during the global financial crisis of 2008.
Growth in net absorption is forecast to resume in Q2 2021, and the total net absorption over the period from Q2 2021 to Q3 2022 will exceed negative absorption from the recession, resulting in overall gains in absorption over the forecast cycle. The lower and upper bounds of the forecast reflect the increased uncertainty faced by the U.S. economy.
This forecast assumes a continued rebound in real GDP for the remainder of 2020. It assumes real GDP will expand by 4% in 2021 and 3% in 2022 and that average unemployment during 2021 and 2022 will be approximately 5.5% and 4.5% respectively. Finally, the forecast assumes that inflation in both years will be 1.75%.
Actual Versus Forecast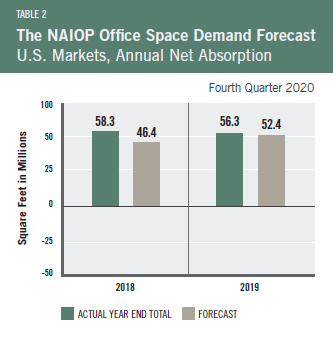
Table 2 compares the forecast to actual net absorption. The forecast for 2019 was 52.4 million square feet, which is 3.9 million square feet less than the 56.3 million square feet that were actually absorbed for the year. The forecast for 2018 was 46.4 million square feet, which is 11.9 million square feet less than the 58.3 million square feet that were actually absorbed for the year. CBRE revised upward the 2018 net absorption figures during the year. Lagged net absorption is a significant variable in the NAIOP Office Space Demand Forecast, so this restatement had significant impacts on the calculation of the fourth quarter 2018 forecast total (11.6 million square feet on average per quarter for 2018) compared to the prior forecast issued in the second quarter of 2018 (8.4 million square feet on average per quarter). The NAIOP Office Space Demand Forecast is published in the second and fourth quarters of each year by the NAIOP Research Foundation. |
Key Inputs and Disclaimers
In January 2016, the NAIOP Research Foundation published “Forecasting Office Space Demand,” a model that forecasts net absorption of U.S. office space on a quarterly basis for eight consecutive quarters. Created by researchers Hany Guirguis, Ph.D., of Manhattan College and Joshua Harris, Ph.D., CRE, CAIA, of New York University, the model is similar to that used for the NAIOP Industrial Space Demand Forecast, which successfully projected a drop and rebound in net absorption of industrial space in 2009 and 2010. (The industrial space demand model was created by Guirguis along with Randy Anderson, Ph.D., then at the University of Central Florida.) Below are the leading, coincident and lagging variables used in the office space demand forecast.
- The growth rate in real gross domestic product (GDP) captures the broadest level of macroeconomic activity, reflecting the value of all goods and services produced in a given year.
- Corporate profits of domestic industries directly captures the financial capacity and growth of firms that may need to expand. Profits are a source of retained earnings, so they provide a clue about how much money is available to fund investments in plants and equipment, an investment activity that raises productive capacity.
- Total employment in the financial services sector is a direct measure and proxy for office-using employment that best fits with changes in office space demand.
- Two variables from the Institute for Supply Management’s Non-Manufacturing Indices serve as proxies for a sentiment measure on the future health of office-using firms. The ISM-NM Inventories Index measures increases and decreases in inventory levels, while the ISM-NM Supplier Deliveries Index measures how long it takes suppliers to deliver parts and materials that are integral to service sector businesses.
These five measures — along with the lagged measures of net absorption of office space, which serve as the base of the model — make possible an accurate two-year forecast of net absorption of office space nationwide. The methods used in the forecast are dynamic rather than static, to account for the changing nature of the underlying macro economy.
Office absorption data are provided by CBRE Econometric Advisors, which assumes no responsibility for this forecast. The absorption forecast tracks with CBRE office data and may vary when compared to other data sets. Data include office buildings in the U.S. with a minimum rentable building area that ranges from 10,000 to 150,000 square feet, depending on the market. The current forecast is based on third-quarter 2020 data.
Authors
Professor Hany Guirguis, Ph.D., O’Malley School of Business, Manhattan College Professor
Timothy H. Savage, Ph.D. CRE, Schack Institute of Real Estate, New York University
Media Inquiries
Please contact Kathryn Hamilton, CAE, vice president for marketing and communications, at hamilton@naiop.org.
1 “Real Gross Domestic Product (A191RO1Q156NBEA),” FRED Economic Data, Federal Reserve Bank of St. Louis, https://fred.stlouisfed.org/series/A191RO1Q156NBEA.
2 “Gross Domestic Product, Third Quarter 2020 (Advance Estimate),” Bureau of Economic Analysis, U.S. Department of Commerce, October 29, 2020, https://www.bea.gov/news/2020/gross-domestic-product-third-quarter-2020-advance-estimate.
3 “Initial Claims (ICSA),” FRED Economic Data, Federal Reserve Bank of St. Louis, https://fred.stlouisfed.org/series/ICSA.
4 Elise Gould and Melat Kassa, “Young workers hit hard by the COVID-19 economy,” Economic Policy Institute, October 14, 2020, https://www.epi.org/publication/young-workers-covid-recession/.
5 “Labor Force Participation Rate (CIVPART),” FRED Economic Data, Federal Reserve Bank of St. Louis, https://fred.stlouisfed.org/series/CIVPART/.
6 “10-Year Breakeven Rate (T10YIE),” FRED Economic Data, Federal Reserve Bank of St. Louis, https://fred.stlouisfed.org/series/T10YIE.
7 “CBOE Volatility Index: VIX (VIXCLS),” FRED Economic Data, Federal Reserve Bank of St. Louis, https://fred.stlouisfed.org/series/VIXCLS/.
8 “Industries at a Glance,” U.S. Bureau of Labor Statistics, https://www.bls.gov/iag/tgs/iag_index_naics.htm; “Labor Force Statistics from the Current Population Survey,” U.S. Bureau of Labor Statistics, https://www.bls.gov/cps/.
9 Peter Grant and Emma Tucker, “Manhattan Offices Are Nearly Empty, Threatening New York City’s Recovery,” The Wall Street Journal, September 29, 2020, https://www.wsj.com/articles/manhattan-offices-are-nearly-empty-threatening-new-york-citys-recovery-11601371800?mod=hp_lead_pos11.