


Office Space Demand Forecast, Second Quarter 2016
Release Date: June 2016
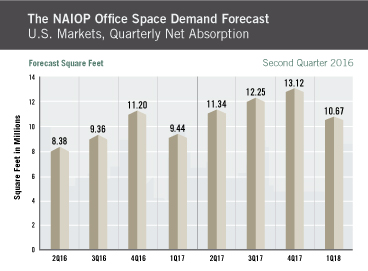
Economic Flattening Points to Declining Demand for U.S. Office Space Through 2017
The national office market is forecast to absorb approximately 34.6 million square feet of space in 2016, down from 62.1 million square feet in 2015, as economic growth flattens in the U.S., according to Dr. Hany Guirguis, Manhattan College, and Dr. Joshua Harris, University of Central Florida. Gross domestic product (GDP) growth, which slowed to 0.5 percent in the first quarter of 2016, is forecast by the model to remain low, near 1 to 2 percent annualized growth, with the lower boundary of the GDP forecast dipping into slightly negative territory. The current forecast projects net absorption of office space to regain some strength in 2017, totaling approximately 46.2 million square feet. However, this figure could change, depending on how the economy fares throughout the rest of 2016.
Overall, the U.S. economic condition is more tenuous in mid-2016 than it has been in recent years. Low energy prices and a declining global economic outlook — due, in part, to European debt crises and a slowing Chinese economy — have finally had a measurable impact on the domestic situation. The biggest drag on the forecast comes from lower GDP expectations going forward and falling rates of nonresidential private fixed investment, which measures the willingness of private businesses to expand their productive capacity. The second most significant driver of the forecast relates to declining corporate profits, which have been falling since the fourth quarter of 2015, a reversal of a trend that bears watching and is a cause for concern, especially for the office sector.
“Employment, both overall and in the office-using sectors, had maintained fairly steady growth until the most recent reading for April 2016, which registered only 160,000 net new jobs. This was well below the 200,000 jobs-permonth threshold considered the minimum necessary for sustained economic growth,” says Harris. “We expect the overall declines in macroeconomic output to continue to result in lower employment gains for the rest of 2016.
“The office-using sectors are forecast by our model to decline in their rate of growth as well, but this has yet to register in the available data. We forecast that office-using employment gains will soften in 2016 as those sectors feel the impact of less macroeconomic activity. If the office sector manages to maintain its level of growth despite the economic headwinds, office absorption will likely be closer to the high end of the forecast range, which is 35.1 million square feet for 2016 and 49.1 million square feet for 2017. Indicators from the Institute for Supply Management Non-Manufacturing indices are not yet showing a decline, but we believe the falloff will come.”
Finally, it is important to note that the current readings and forecasts for economic indicators point to an economy approaching a point of inflection, one that is moving from expansion to contraction. This is the most difficult environment in which to make forecasts, as these changes can occur more or less rapidly than statistical analyses can predict. “Overall, we are not yet forecasting a recession or significant downturn, just a flattening that should cause office demand to level off,” Guirguis and Harris conclude. “Further, since the economy has been growing slowly for the past several years, it is likely that there is not enough “overheating” for a recession. If one were to occur, chances are it would not last very long or be very deep. Office markets do not yet appear to be overbuilt nationwide. Therefore we do not expect significant negative impacts to the office property sector.” Still, any reduction in net demand for office space is likely to soften rental rates and, thus, impact the bottom line of office investors and developers.
Key Inputs and Disclaimers
In January 2016, the NAIOP Research Foundation published “Forecasting Office Space Demand,” a model that forecasts net absorption of U.S. office space on a quarterly basis for eight consecutive quarters. Created by researchers Hany Guirguis, Ph.D., of Manhattan College and Joshua Harris, Ph.D., CRE, CAIA, of the University of Central Florida, the model is similar to that used for the NAIOP Industrial Space Demand Forecast, which successfully projected a drop and rebound in net absorption of industrial space in 2009 and 2010. (The industrial space demand model was created by Guirguis along with Randy Anderson, Ph.D., of the University of Central Florida.) Below are the leading, coincident and lagging variables used in the office space demand forecast.
- The growth rate in real gross domestic product (GDP) captures the broadest level of macroeconomic activity, reflecting the value of all goods and services produced in a given year.
- Corporate profits of domestic industries directly captures the financial capacity and growth of firms that may need to expand. Profits are a source of retained earnings, so they provide a clue about how much money is available to fund investments in plant and equipment, an investment activity that raises productive capacity.
- Total employment in the financial services sector is a direct measure and proxy for office-using employment that best fits with changes in office space demand.
- Two variables from the Institute for Supply Management’s Non-Manufacturing Indices serve as proxies for a sentiment measure on the future health of office-using firms. The ISM-NM Inventories Index measures increases and decreases in inventory levels, while the ISM-NM Supplier Deliveries Index measures how long it takes suppliers to deliver parts and materials that are integral to service sector businesses.
These five measures — along with the lagged measures of net absorption of office space, which serve as the base of the model — make possible an accurate two-year forecast of net absorption of office space nationwide. The methods used in the forecast are dynamic rather than static, to account for the changing nature of the underlying macro economy.
Office absorption data are provided by CBRE Econometric Advisors, which assumes no responsibility for this forecast. The absorption forecast tracks with CBRE office data and may vary when compared to other data sets. Data include office buildings in the U.S. with a minimum rentable building area that ranges from 10,000 to 150,000 square feet, depending on the market.
Actual versus Forecast
Because this is the first forecast in this series, it is not yet possible to compare the forecast with actual net absorption. Each future report will include a table that shows actual versus forecast net absorption.