


Office Space Demand Forecast, Second Quarter 2019
Release Date: May 2019
Office Leasing Activity Expected to Grow Amid Sustained U.S. Economic Strength
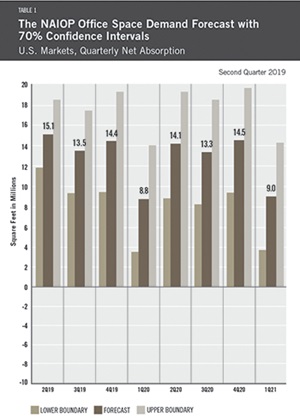
The U.S. office market continues to expand ahead of forecast, posting 18 million square feet of net absorption in the fourth quarter of 2018 and 11 million square feet in the first quarter of 2019. Continued economic growth and increases in job creation are likely the main forces behind these levels of new leasing.
With first-quarter U.S. GDP growth of 3.2% annualized and a current unemployment rate of 3.6%, U.S. office space demand should remain strong during 2019. Dr. Harry Guirguis, Manhattan College, and Dr. Joshua Harris, New York University expect demand to register an average of 13.5 million square feet of net absorption per quarter, which will moderate slightly to an average of 12.7 million square feet per quarter in 2020. This forecast is driven by continued expected strength in office-using employment, which has grown twice as fast as general employment. According to the U.S. Department of Labor’s March 2019 jobs report, the primary office-using sector, Professional and Business Services, grew 1.22% year-over-year compared to just 0.6% for total nonfarm employment.
 The continued strength in the office demand forecast for 2019 also likely represents a partial reversal of the recent trend in decreasing square footage per employee. The faster pace of leasing in 2018 through the first quarter of 2019 appears to be a response to high rates of office-using employment growth in 2016 and 2017. Due to job creation and sustained office-leasing activity, some tenants may have reached the limits of their office footprint reductions. As firms grow in response to economic opportunity, they may feel pressure to add more space per employee. However, newer coworking concepts such as WeWork are just beginning to expand into smaller markets. Therefore, the potential exists for unpredictable future disruptions.
While the possibility of a late 2019 or early 2020 economic slowdown seemed plausible at the end of last year, current economic data suggests that the next downturn is more likely to occur in 2021. Overall job creation, unemployment, consumer confidence and interest rates all support the continued economic growth experienced for the past several years. The authors expect U.S. GDP growth and job creation to moderate by the end of 2019 and during 2020, which means the forecasted rate of net office absorption is expected to be lower in 2020 than 2019.
Key Inputs and Disclaimers
In January 2016, the NAIOP Research Foundation published “Forecasting Office Space Demand,” a model that forecasts net absorption of U.S. office space on a quarterly basis for eight consecutive quarters. Created by researchers Hany Guirguis, Ph.D., of Manhattan College and Joshua Harris, Ph.D., CRE, CAIA, of New York University, the model is similar to that used for the NAIOP Industrial Space Demand Forecast, which successfully projected a drop and rebound in net absorption of industrial space in 2009 and 2010. (The industrial space demand model was created by Guirguis along with Randy Anderson, Ph.D., then at the University of Central Florida.) Below are the leading, coincident and lagging variables used in the office space demand forecast.
- The growth rate in real gross domestic product (GDP) captures the broadest level of macroeconomic activity, reflecting the value of all goods and services produced in a given year.
- Corporate profits of domestic industries directly captures the financial capacity and growth of firms that may need to expand. Profits are a source of retained earnings, so they provide a clue about how much money is available to fund investments in plants and equipment, an investment activity that raises productive capacity.
- Total employment in the financial services sector is a direct measure and proxy for office-using employment that best fits with changes in office space demand.
- Two variables from the Institute for Supply Management’s Non-Manufacturing Indices serve as proxies for a sentiment measure on the future health of office-using firms. The ISM-NM Inventories Index measures increases and decreases in inventory levels, while the ISM-NM Supplier Deliveries Index measures how long it takes suppliers to deliver parts and materials that are integral to service sector businesses.
These five measures — along with the lagged measures of net absorption of office space, which serve as the base of the model — make possible an accurate two-year forecast of net absorption of office space nationwide. The methods used in the forecast are dynamic rather than static, to account for the changing nature of the underlying macro economy.
Office absorption data are provided by CBRE Econometric Advisors, which assumes no responsibility for this forecast. The absorption forecast tracks with CBRE office data and may vary when compared to other data sets. Data include office buildings in the U.S. with a minimum rentable building area that ranges from 10,000 to 150,000 square feet, depending on the market.
Actual versus Forecast
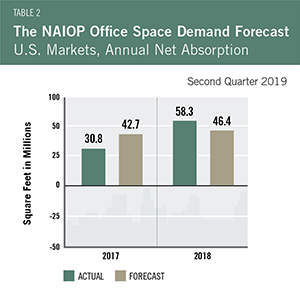 Table 2 compares the forecast to actual net absorption. The forecast for 2018 was 46.4 million square feet, which is 11.9 million square feet less than the 58.3 million square feet that were actually absorbed for the year. CBRE revised upward the 2018 net absorption figures during the year. Lagged net absorption is a significant variable in the NAIOP Office Space Demand Forecast, so this restatement had significant impacts on the calculation of the fourth quarter 2018 forecast total (11.6 million square feet on average per quarter for 2018) compared to the prior forecast issued in the second quarter of 2018 (8.4 million square feet on average per quarter for the remaining three quarters of 2018).
This forecast is based on first-quarter 2019 data.