


Industrial Space Demand Forecast, First Quarter 2021
Release Date: February 2021
SPECIAL WEBINARIn a special webinar recorded April 12, 2021, what are the factors impacting industrial demand, and what are the opportunities and challenges that lie ahead for the sector? Members can listen to the webinar on-demand at no cost (use member login to access); nonmembers can purchase the webinar recording. |
Strong Growth in Demand for Industrial Space
Industrial real estate remains the leading property type as the pandemic accelerated an existing long-term trend toward increased e-commerce. As last-mile delivery is key for consumers, the distribution infrastructure will need to add more space. Delivery times slowed considerably during the pandemic, due in part to supply chain issues, and consumers now want deliveries made faster than ever. That means larger inventories and increased occupier demand. More cold storage and large distribution centers are also expected moving forward.
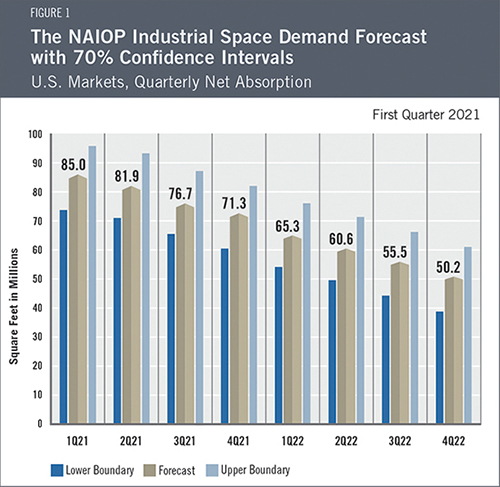
Therefore, according to authors Dr. Hany Guirguis and Dr. Michael J. Seiler, total net absorption in 2021 is forecast to be 314.9 million square feet with a quarterly average of 78.7 million square feet. In 2022, net absorption is projected to be 231.6 million square feet with a quarterly average of 57.9 million square feet.
When the pandemic broke, there was a brief decline in net absorption, reflecting the tumultuous state of the economy. Since then, the CARES Act and subsequent stimulus packages have contributed to a sharp increase in net absorption, which has reached the highest rate since 2000. This rate of growth reflects a rebound in demand for industrial real estate and a return to long-term growth. Industrial rents continue to increase (more so along the coastal U.S. than in the Midwest), vacancy rates remain low, and transaction prices per square foot are higher, although deal flow has understandably experienced a modest decline. It is unusual to see such a high level of net absorption while the economy is still in a recession, but this is an unusual time in U.S. history.
When the economy stabilizes, fundamentals will once again drive market behavior, and net absorption rates will likely mean-revert toward long-term growth trends. This is not to say that absorption rates will immediately slow; merely that the recent sharp increase in net absorption is unsustainable. The industrial market was already trending toward higher future demand between the first and third quarters of 2020 after experiencing a downward trend in the previous four years. However, the pandemic accelerated that demand, resulting in a short-term spike in net absorption. As more industrial tenants secure the space they need, net absorption rates will gradually dissipate in the coming quarters to levels that will likely be only slightly higher than economic fundamentals would have predicted before the pandemic.
Economic Trends
2020 will go on record as one of the most disruptive years in modern history. Without certainty about when it will be safe to lift pandemic restrictions, it remains unclear when the economy can fully reopen, when people can safely return to their workplaces, when the unemployment rate will decrease and when GDP will stabilize. These factors will certainly affect the demand for industrial real estate, and there will most likely be a more precise picture in the third quarter 2021 forecast.
As of this writing, the U.S. Congress is considering economic relief proposals ranging in size from $618 billion to $1.9 trillion. The economic effects of the additional stimulus will depend on its size and scope. Nonetheless, it currently appears likely that a continuation of expanded unemployment benefits and another round of direct payments to taxpayers will be included in any bill that becomes law. These measures should help support consumer spending and thus continued growth in demand for industrial space.
The Forecast Model
In the statistical model, the authors utilize a variety of explanatory drivers such as the lagged net absorption, growth in real gross domestic product, inflation and output gaps, monetary policy and seasonal effects. Forecast models require historical data and perform most reliably when market conditions are stable — which does not adequately describe the current environment. Readers should note that the confidence intervals remain larger than in pre-pandemic forecasts, though much narrower than in the Third Quarter 2020 Industrial Demand Space Demand Forecast. As a result, the authors have taken extra measures to stress-test the model and build several different scenarios moving forward.
Actual Versus Forecast
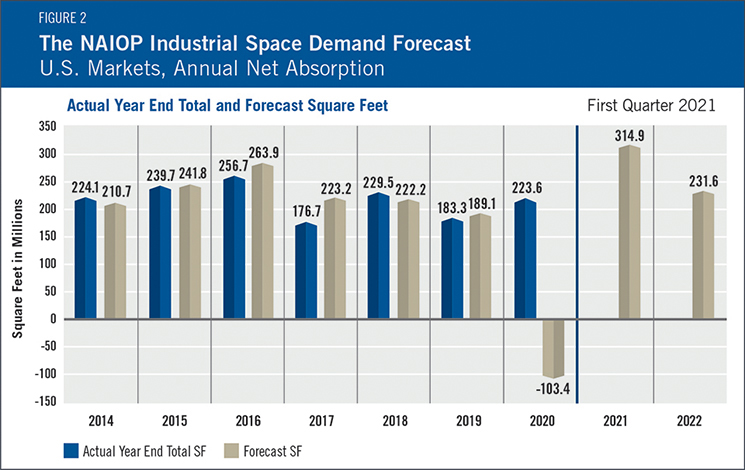
Net absorption in 2020 was higher than in 2019, reflecting a surge in ecommerce-related activity in the second half of the year (see Figure 2). During 2020, 223.6 million square feet of industrial space was absorbed, compared with the forecast of -103.4 million square feet.
Key Inputs and Disclaimers
The predictive model is funded by the NAIOP Research Foundation and was developed by Guirguis and Randy Anderson, Ph.D., formerly of the University of Central Florida. The model, which forecasts demand for industrial space at the national level, utilizes variables that comprise the entire supply chain and lead the demand for space, resulting in a model that is able to capture the majority of changes in demand.
While leading economic indicators have been able to forecast recessions and expansions, the indices used in this study are constructed to forecast industrial real estate demand expansions, peaks, declines and troughs. The Industrial Space Demand model was developed using the Kalman filter approach, where the regression parameters are allowed to vary with time and thus are more appropriate for an unstable industrial real estate market.
The forecast is based on a process that involves testing more than 40 economic and real estate variables that theoretically relate to demand for industrial space, including varying measures of employment, GDP, exports and imports, and air, rail and shipping data. Leading indicators that factor heavily into the model include the Federal Reserve Board’s Index of Manufacturing Output (IMO), the Purchasing Managers Index (PMI) from the Institute of Supply Management (ISM) and net absorption data from CBRE Econometric Advisors.
Authors
Hany Guirguis, Ph.D., Professor, Economics and Finance, Manhattan College
Michael J. Seiler, DBA, J.E. Zollinger Professor of Real Estate & Finance, College of William & Mary
Media Inquiries
Please contact Kathryn Hamilton, vice president for marketing and communications, at hamilton@naiop.org.
* Research reports are complimentary to all audiences. Webinars are free for members and paid for nonmembers.