


Industrial Space Demand Forecast, First Quarter 2023
Release Date: March 2023
Despite rising interest rates and growth in the supply of new space entering the market, the outlook for industrial real estate remains bright as supply chain conditions steadily improve. Low vacancy rates will continue to support growth in rents and property values.
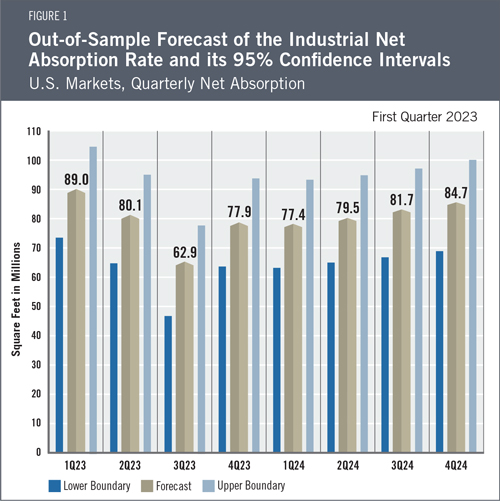
Net absorption of industrial space in the last two quarters of 2022 was 176.1 million square feet, down from 236.4 million square feet in the first two quarters of the year. Given current economic conditions and recent demand trends, the authors estimate that quarterly net absorption of industrial space will average 79.0 million square feet over the next two years. Total net absorption for 2023 is forecast to be approximately 310 million square feet, and full-year absorption in 2024 is forecast to be around 323 million square feet (see Figure 1 for quarterly projections).
The Industrial Market
 The Federal Reserve has increased interest rates at each of its last eight meetings. While rising interest rates have increased the cost of borrowing, the supply of industrial real estate continues to lag demand. The net result is a continued trend of higher rents and higher property prices.
Supply chain issues that hindered the delivery of construction materials through western ports have been mostly resolved, but demand for industrial space around these ports continues to exceed supply, contributing to demand for space in inland markets. The shortage of space along the West Coast is also contributing to strong markets for industrial space on the East Coast as more supply chains are rerouted through eastern ports. Demand for e-commerce is expected to grow as consumers continue to expect quick home delivery and traditional retailers increasingly adopt omnichannel distribution.
These trends should continue to create demand for last-mile distribution facilities, particularly near dense and growing areas.
However, amid softening economic conditions, the forecast’s authors expect the slowdown in industrial space absorption that began in the last half of 2022 to continue into 2023.
Economic Trends
Real GDP has grown over two consecutive quarters,1 and the Federal Reserve has steadily increased interest rates in an attempt to quell inflation. Inflation remains high, currently 6.4% year-over-year, but has steadily decreased from its 40-year high of 9.1% in June.2 The unemployment rate stands at 3.4%, the lowest it has been since 1969.3 Personal income moderately increased during the last quarter, as did personal saving rates, which bodes well for the resiliency of American consumers. However, inflation-adjusted spending on goods peaked in 2021 as consumers shifted more spending to services last year,4 contributing to the recent softening of the industrial real estate market. Taken together, recent developments suggest that the odds have improved for the Federal Reserve to contain inflation while avoiding a severe recession. Barring unforeseen challenges, the economy should continue to support growth in demand for industrial space, albeit at a slower pace than in the last two years.
The Forecast Model
The authors utilize various explanatory drivers in the forecast’s statistical model, such as lagged net absorption, real gross domestic product growth, inflation and output gaps, monetary policy, and seasonal effects. The current forecast has been revised upward to account for the resilient economy and revised historical net absorption data. The predicted net absorption during 2023 is 309.8 million square feet with lower and upper boundaries of 248.3 and 371.3 million square feet, respectively. The full-year forecast for industrial absorption in 2024 is 323.2 million square feet, with lower and upper boundaries of 261.7 and 384.7 million square feet.
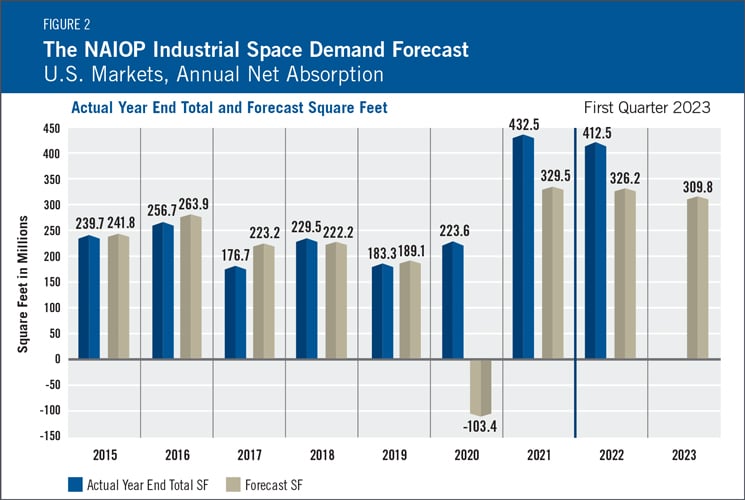
Actual Versus ForecastNet absorption in 2022 was down slightly from 2021, reflecting cooling economic growth and a shift in consumer spending from goods to services (see Figure 2). During 2022, 412.5 million square feet of industrial space was absorbed, compared with the forecast of 326.2 million square feet. Note that CBRE Econometric Advisors substantially revised its historical absorption data for the first two quarters of 2022, increasing reported absorption in the first half of the year by 85.2 million square feet (equivalent to 99% of the difference between the actual absorption and the forecast absorption for the year). Since lagged absorption has a significant effect on the predictive model, the lower absorption data that was then available for the third-quarter forecast resulted in a lower forecast for the second half of 2022 than would have been the case if the authors had received the current version of the historical data. The first-quarter 2022 forecast had predicted absorption of 401.4 million square feet for 2022, or 2.7% less than the actual absorption for the year. |
Key Inputs and Disclaimers
The predictive model is funded by the NAIOP Research Foundation and was developed by Guirguis and Randy Anderson, PhD, formerly of the University of Central Florida. The model, which forecasts demand for industrial space at the national level, utilizes variables that comprise the entire supply chain and lead the demand for space, resulting in a model that can capture most changes in demand.
While leading economic indicators have been able to forecast recessions and expansions, the indices used in this study are constructed to forecast industrial real estate demand expansions, peaks, declines and troughs. The Industrial Space Demand model was developed using the Kalman filter approach, where the regression parameters are allowed to vary with time and thus are more appropriate for an unstable industrial real estate market.
The forecast is based on a process that involves testing more than 40 economic and real estate variables that theoretically relate to demand for industrial space, including varying measures of employment, GDP, exports and imports, and air, rail and shipping data. Leading indicators that factor heavily into the model include the Federal Reserve Board’s Index of Manufacturing Output (IMO), the Purchasing Managers Index (PMI) from the Institute of Supply Management (ISM) and net absorption data from CBRE Econometric Advisors.
Authors
Hany Guirguis, Ph.D., Professor, Economics and Finance, Manhattan College
Michael J. Seiler, DBA, J.E. Zollinger Professor of Real Estate & Finance, College of William & Mary
Media Inquiries
Please contact Kathryn Hamilton, vice president for marketing and communications, at hamilton@naiop.org.
1 Bureau of Economic Analysis, “Gross Domestic Product, Fourth Quarter and Year 2022 (Advance Estimate),” news release, January 26, 2023, https://www.bea.gov/news/2023/gross-domestic-product-fourth-quarter-and-year-2022-advance-estimate. Real GDP increased by 3.2% in 2022Q3 and by another 2.9% in 2022Q4.
2 U.S. Bureau of Labor Statistics, “Consumer Price Index Summary,” news release, February 14, 2023, https://www.bls.gov/news.release/cpi.nr0.htm.
3 U.S. Bureau of Labor Statistics, “Employment Situation Summary,” news release, February 3, 2023, https://www.bls.gov/news.release/empsit.nr0.htm.
4 Bureau of Economic Analysis, “Personal Income and Outlays, December 2022,” news release, January 27, 2023, https://www.bea.gov/news/2023/personal-income-and-outlays-december-2022.