


Office Space Demand Forecast, Fourth Quarter 2021
Release Date: November 2021
Forecast Absorption Surges to Positive Gains in Q4 and Beyond
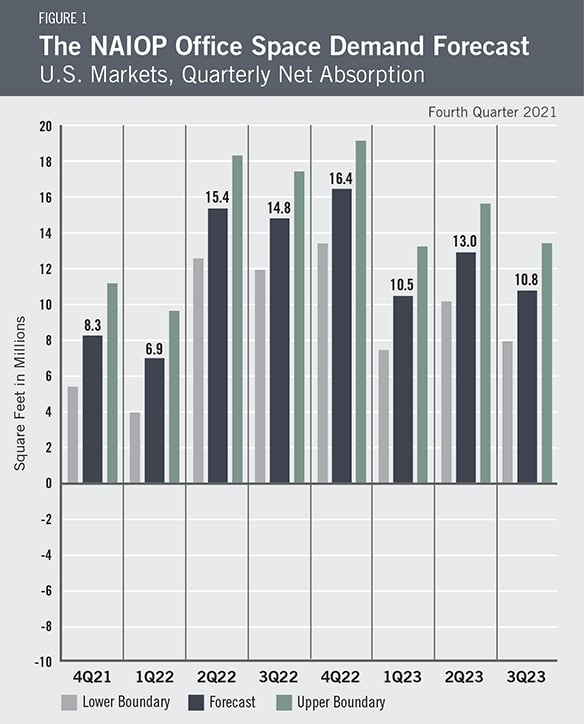 Although office net absorption remained negative throughout 2021, it is gradually climbing toward the positive side of the scale. Total net absorption in the third quarter of 2021 was -5.2 million square feet, back from a near record of -34.8 million square feet at the end of the first quarter of 2021. As the unemployment rate declines, more workers return to the office and the economy continues to improve, the office space net absorption forecast has been revised upward from 1.8 million square feet to 8.3 million square feet in Q4 2021. The total net absorption in 2022 is forecast to be 53.5 million square feet with a quarterly average of 13.4 million square feet. In 2023, the projected net absorption is 34.3 million square feet during the first three quarters, with a quarterly average of 11.4 million square feet (Figure 1).
This forecast is dependent on continued economic growth, which seems plausible given recent data. The measured unemployment rate in September was 4.8%, down from 6.1% in April.1 Supply chain issues have resulted in higher consumer prices and stoked inflationary concerns. Still, real Gross Domestic Product (GDP) rose at an annualized rate of 2.0% in Q3 2021, a pace that cooled from the Q2 2021 real GDP growth rate of 6.7%.2
Although the number of people currently employed in professional and business services, financial activities and information industries is only 1.5% lower than in February 2020,3 office utilization rates remain much lower than before the pandemic due to continued concerns about coronavirus transmission. A late summer surge in the delta variant of the coronavirus delayed many firms’ return-to-the-office plans. Since then, infection, hospitalization and death rates have all declined, signaling it is now safer to return to in-person interactions when compared to just two months ago. Office access data collected by Kastle Systems for 10 large U.S. metropolitan areas indicate an average office utilization rate of 36.8% in late October, up slightly from 36.1% at the beginning of the month, but still a long way from the near-full utilization rates recorded in early March 2020.4
Given a nationwide labor shortage, recruitment and retention are primary concerns for employers. With workers demanding not only greater wages and benefits, but also more flexible working conditions, employers are likely to continue to offer hybrid and remote work options at higher rates than before the pandemic. Employers in central business districts (CBD), where commute times are longer and more burdensome, are more likely to offer workers remote or hybrid work options. Organizations that reduce the number of employees entering the office each day are more likely to reallocate space from individual offices and workstations to collective workspaces. Many will adopt shared desk arrangements (such as hot desking or hoteling) to reserve more space for collaborative work. While a long-term increase in remote and hybrid work arrangements is likely to reduce demand for office space, this should be more than offset in coming years by employment growth in office-using industries.
A gradual increase in office utilization rates and long-term employer plans to return to the office should begin to reduce the vacancy rate for office space. Leasing activity has picked up, cap rates have slightly declined and deal flow has remained healthy. These trends have favored suburban markets more than CBDs. Demand for new office buildings is favorable, as new builds offer the flexible work environments demanded in today’s more uncertain world. This trend should continue over the next year.
The Forecast Model
The model that informs this forecast draws from historical data on the economy and office real estate absorption to project future demand. Recent trends in office absorption suggest that office-sector performance will reflect economic conditions, as in past economic cycles. This forecast assumes a continued rebound in real GDP for the remainder of 2021, 2022 and 2023. Real GDP is expected to expand by 3.8% in 2022 and 2.5% in 2023, with an unemployment rate of 3.8% and 3.5% in 2022 and 2023. The forecast also assumes that the office absorption rate will be 15% to 20% below what it would usually be in a similar macroeconomic environment.
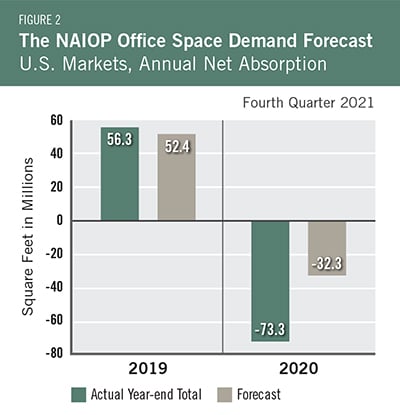
Actual Versus ForecastFigure 2 compares the forecast to actual net absorption. The forecast value tallies the most recent forecast data for each quarter in the year. For 2020, data for the first quarter are from the forecast published in the fourth quarter of 2019, prior to the pandemic, when there was little reason to expect negative net absorption. Forecast data for the second and third quarters are from the second-quarter forecast published in May 2020, before the duration of the pandemic or the extent of its effect on the economy or office absorption were apparent. That forecast had assumed an economic contraction of 2.5% in the first quarter and 6.5% in the second quarter. The actual contraction was much more severe (-5.1% in the first quarter and -31.2% in the second quarter), resulting in a more severe impact on office absorption. The forecast for 2020 was -32.3 million square feet, which is 41 million square feet less than the -73.3 million square feet that were absorbed for the year. The forecast for 2019 was 52.4 million square feet, which is 3.9 million square feet less than the 56.3 million square feet that were absorbed for the year. |
Key Inputs and Disclaimers
In January 2016, the NAIOP Research Foundation published “Forecasting Office Space Demand,” a model that forecasts net absorption of U.S. office space on a quarterly basis for eight consecutive quarters. Created by researchers Hany Guirguis, Ph.D., of Manhattan College, and Joshua Harris, Ph.D., CRE, CAIA, the model is similar to that used for the NAIOP Industrial Space Demand Forecast, which successfully projected a drop and rebound in net absorption of industrial space in 2009 and 2010. (The industrial space demand model was created by Guirguis along with Randy Anderson, Ph.D., then at the University of Central Florida.) Below are the leading, coincident and lagging variables used in the office space demand forecast.
- The growth rate in real gross domestic product (GDP) captures the broadest level of macroeconomic activity, reflecting the value of all goods and services produced each year.
- Corporate profits of domestic industries directly captures the financial capacity and growth of firms that may need to expand. Profits are a source of retained earnings, so they provide a clue about how much money is available to fund investments in plants and equipment, an investment activity that raises productive capacity.
- Total employment in the financial services sector is a direct measure and proxy for office-using employment that best fits with changes in office space demand.
- Two variables from the Institute for Supply Management’s Non-Manufacturing Indices serve as proxies for a sentiment measure on the future health of office-using firms. The ISM-NM Inventories Index measures increases and decreases in inventory levels, while the ISM-NM Supplier Deliveries Index measures how long it takes suppliers to deliver parts and materials that are integral to service-sector businesses.
- Core Personal Consumption Inflation Rate (PCE Inflation).
These five measures make possible an accurate two-year forecast of net absorption of office space nationwide. The methods used in the forecast are dynamic rather than static, to account for the changing nature of the underlying macro economy.
Office absorption data are provided by CBRE Econometric Advisors, which assumes no responsibility for this forecast. The absorption forecast tracks with CBRE office data and may vary when compared to other datasets. Data include office buildings in the U.S. with a minimum rentable building area that ranges from 10,000 to 150,000 square feet, depending on the market. The current forecast is based on third-quarter 2021 data.
Authors
Hany Guirguis, Ph.D., Professor, Economics and Finance, Manhattan College
Michael J. Seiler, DBA, J.E. Zollinger Professor of Real Estate & Finance, College of William & Mary
Media Inquiries
Please contact Kathryn Hamilton, CAE, vice president for marketing and communications, at hamilton@naiop.org.
* Office Space Demand Forecasts are complimentary to all audiences. Webinars are free for members and paid for nonmembers.
1 U.S. Bureau of Labor Statistics, “Economy at a Glance: United States – Monthly Data,” https://www.bls.gov/eag/eag.us.htm.
2 U.S. Bureau of Economic Analysis, “Gross Domestic Product, Third Quarter 2021 (Advance Estimate),” news release (October 28, 2021), https://www.bea.gov/sites/default/files/2021-10/gdp3q21_adv.pdf.
3 U.S. Bureau of Labor Statistics, “Graphics for Economic News Releases: Employment by Industry,” https://www.bls.gov/charts/employment-situation/employment-levels-by-industry.htm.
4 “Kastle Back to Work Barometer,” Kastle Systems, https://www.kastle.com/safety-wellness/getting-america-back-to-work/.