
Trends in Square Feet per Office Employee: An Update

Is the push for office space efficiency a silent killer for the U.S. office market?
THE SHIFT TOWARD online shopping has wreaked havoc on many traditional brick-and-mortar retail tenants, and by now, most landlords of all property types have had just about enough of fast-emerging trends that change how businesses utilize their real estate footprints. Yet one of the largest office users in the U.S., the federal government’s General Services Administration, is in the midst of a major effort to use its office space more efficiently. Meanwhile, within the private sector, “creative” office environments — often accompanied by “benching” layouts, where multiple workers share a single large table — are becoming all the rage. Real estate investors are wondering whether the office sector is next in line for a painful shakeup, as tenants continue to use office space more efficiently.
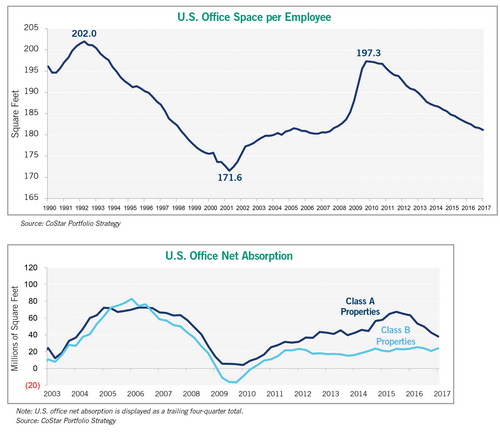
The graph labeled “U.S. Office Space per Employee” plots the amount of occupied office space per office worker in the U.S. over time. Think of this as the level of spaciousness within the typical American office at any given time. Despite jumps that occur during recessions, when many companies cut staffing levels but retain their existing office leases, the long-term trend in square footage per worker is clearly down. Smaller computers, digitized libraries and the entrance of the so-called “sharing generation” into the workforce have all made it easier for companies to fit more workers into less space. Landlords are understandably leery of this trend, since greater space efficiency means tenants will lease less office space overall.
The impact of tenants’ push for greater space efficiency has created winners and losers within the office market. Fitting more employees into less space has definitely enabled office tenants to sign smaller leases. But the savings from signing smaller leases allow tenants to afford higher-end space. This is a particularly compelling tradeoff in the current market, as tenants are increasingly relying on amenity-rich office environments to help recruit the highly skilled workers who are now in short supply. The recent shift in leasing from Class B properties to higher-end Class A properties has been enormous. Whereas U.S. office absorption in the Class A and B office markets was nearly identical from 2004 to 2007, since the end of 2011, absorption in the Class A market has outpaced that in the larger Class B market by more than 145 million square feet, about the size of the entire Denver office market. Moreover, the spread between Class A and Class B office absorption reached a record high in 2015.
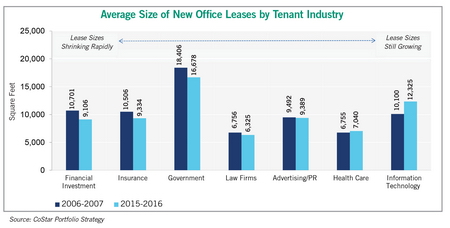
The speed at which tenants are adapting their floor plans to accommodate more workers also varies by industry. In general, tenants in more rapidly growing sectors are simply more focused on expanding their operations and leasing high-end, amenity-rich office space to help recruit scarce talent. Tenants within slower-growing, more revenue-challenged sectors are significantly more focused on economizing their office space use as a way of cutting costs. This trend is reflected in analysis of CoStar’s database of more than 2 million U.S. office leases. (see graph) While the average lease size has fallen since 2006/2007 for tenants in slower-growing sectors such as legal services and government, lease sizes have increased in more rapidly growing sectors such as health care and information technology.
Adrian Ponsen is senior real estate economist at CoStar Portfolio Strategy.

RELATED ARTICLES YOU MAY LIKE