


The NAIOP Market Monitor
Release Date: July 2023
Introduction
The NAIOP Market Monitor is a new report that builds on two previous NAIOP Research Foundation studies that evaluated the potential for two-dimensional analysis of office and industrial real estate markets, A New Look at Market Tier and Ranking Systems and A Two-Dimensional Approach to Evaluating Commercial Real Estate Markets.
The two-dimensional grid underlying this report is an evolution from ranking markets along a single dimension, such as tiers. Both models, ranking and two-dimensional analysis, reveal how markets change over time, but the two-dimensional system provides more information by measuring changes across multiple variables.
There are distinct advantages to the two-dimensional analysis, as it provides a deeper understanding of market dynamics. Evaluating data in a tier or ranking model only considers one dimension. Even when an analyst incorporates several different variables into a ranking methodology, placing markets in an ordinal or tier ranking can obscure certain information. The NAIOP Market Monitor’s two-dimensional grid reveals changes over time in both sales volume and volatility, giving insight into risks that may not be apparent in traditional one-dimensional models.
The NAIOP Market Monitor also tells a broader story about transactional volume shifts and volatility. This may help investors and developers create better strategies around market entry and exit, and to more easily identify markets that match risk and return objectives or merit further examination.
In this first NAIOP Market Monitor report, the authors compare the positions of large and mid-sized U.S. industrial and office markets in grids at the close of the first quarter of 2023 with the pre-pandemic positions of the same markets at the end of the first quarter of 2019, and highlight some insights usually not seen using a tier or ranking approach. The NAIOP Market Monitor reveals large changes in volatility among major office markets, as well as fluctuations in transaction volume in both office and industrial markets that reflect their performance during the COVID-19 pandemic and the continuing importance of broader demographic trends.

Methodology
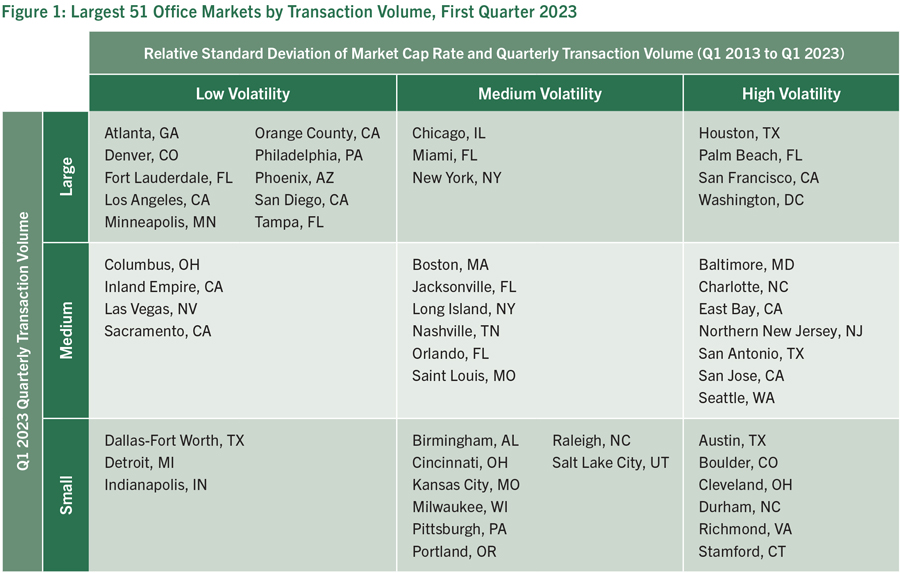
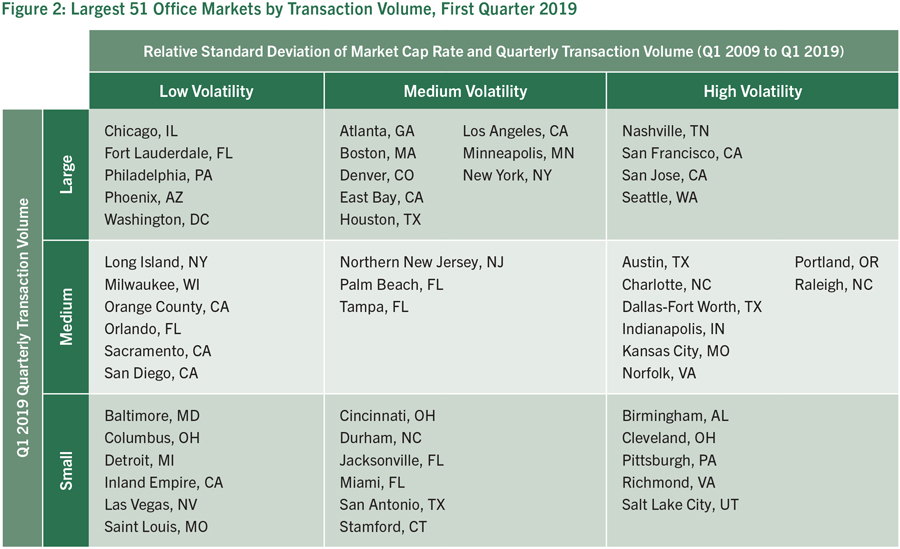
The NAIOP Market Monitor analyzes transaction volume and capitalization rates data provided by CoStar. The largest 102 office and industrial markets in the U.S. are sorted into the largest 51 and next-largest 51 as measured by transaction volume in the most recent quarter. These markets are then arranged in two-dimensional three-by-three grids. Each grid’s vertical axis sorts a set of 51 markets into top, middle and bottom thirds for transaction volume as a measurement of market size (large, medium and small). The grid’s horizontal axis sorts these markets by their volatility, measured as an equal weighting of the relative standard deviation of their respective capitalization (or “cap”) rates and the relative standard deviation of their respective quarterly transaction volume over a 10-year period. The bottom, middle and top third of markets are classified as “low volatility,” “medium volatility” and “high volatility.” Relative standard deviation was chosen as the best measurement of volatility, as it accounts for a market’s size (e.g., small changes in transaction volume are more significant in smaller markets) and average cap rate (a small change in cap rate has a greater effect on real values in a market that previously had a low cap rate than it does in a market that had a high cap rate). The resulting grids allow a user to simultaneously compare markets by size and volatility.
The relative volatility between the largest 51 and the next-largest 51 office and industrial markets can be compared on a percentage basis at a point in time. For the purposes of this report, the authors compared the indexed volatilities of each market type in Q1 2023. Some markets are outliers from the group average, so readers should not directly compare volatility for individual markets that appear in the 51 largest office or industrial markets to those that appear in the second-largest 51 markets.
Office Markets
Pandemic Impacts
Investors typically favor larger markets, perceiving them as having less risk and higher returns. While liquidity is a valid concern for exit strategies, the NAIOP Market Monitor shows that larger markets do not always provide a safety net. Some large-volume office markets in this analysis, such as Chicago and Houston, experienced higher volatility in pricing and transaction volume between Q1 2019 and Q1 2023. In the New York metropolitan area, Long Island, Northern New Jersey and Stamford, Connecticut, reflect the same trend, although New York City maintained its position in relative size and volatility. The volatility increases in these markets can be somewhat attributed to the slow return to the office after the early phase of the COVID-19 pandemic, which created uncertainty for investors.
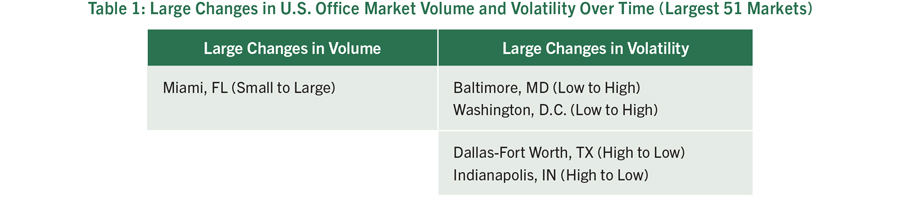
Washington, D.C., displays one of the most noticeable increases in volatility, as federal agencies have been re-evaluating their footprints for several years. Nonprofits and national associations have followed suit, reducing their office leases during the pandemic. This public-sector squeeze would not have jumped out in the tiering model, but the two-dimensional grid model reveals that cities with a large government and nonprofit workforce may not be as immune to increases in office vacancies as has been assumed in the past. These trends also extended north to the neighboring market of Baltimore, which also had a large increase in volatility. By contrast, Dallas-Fort Worth and Indianapolis experienced a large decline in relative volatility, moving two squares from medium volume/high volatility to small volume/low volatility. This likely reflects less activity at favorable pricing.
In addition to these notable changes in volatility among large office markets, the grids also reveal some changes in transaction volumes. Many tech-focused markets, such as San Jose, Seattle and Austin, experienced decreases in transaction activity, though their volatility remained relatively stable. It should not be surprising that these markets have been more sensitive to remote work since the COVID-19 outbreak, as tech firms employ highly skilled workers who can more easily work from anywhere. As the emergency phase of the pandemic has ended and cities and companies encourage workers to return to the office, it will be interesting to see if transaction volume rebounds or if the pandemic shift in work arrangements has a structural impact on office space.
Some of these findings echo observations from a recent CBRE report showing that only 10 percent of the office buildings tracked by the firm are responsible for 80 percent of the occupancy lost (in square feet) from Q1 2020 to Q4 2022. According to the report, these buildings are concentrated in urban downtowns, particularly on the West Coast and in the Northeast.1 This aligns with the decreases in transaction volume in San Jose, Seattle and Boston that are observable in the NAIOP Market Monitor.
Demographic Shifts
The changes in transaction volume in many office markets also reflect demographic shifts, including the migration of households to lower-cost markets, and business growth in the Sunbelt. Florida has several office markets seeing increases in activity.
Although many analysts predicted that suburban office markets would outperform downtowns during the pandemic, the grids indicate that these trends were generally not significant enough for suburbs located in major metropolitan areas such as Northern New Jersey or Long Island to displace mid-sized urban markets like Minneapolis or Denver in total deal volume. One exception is Orange County, California, which rose in total deal volume in the first quarter of 2023, displacing Boston, but this shift may be more reflective of the overall outperformance of Sunbelt markets.
Before 2020, office market transactions were typically concentrated in larger coastal markets like New York, Boston, Washington, D.C., and Los Angeles. Deals now appear to be more spread out geographically, which again may in part reflect demographic shifts. It remains to be seen if these trends are cyclical or structural.
The Relevance of Size
On average, the 51 largest office markets in Q1 2023 experienced 10 percent higher volatility in cap rates and 28 percent lower volatility in sales volumes over the preceding 10 years, compared to the 51 next-largest markets. The lower volatility in sales volumes indicates that bigger office markets remain attractive to investors. However, larger markets tend to experience somewhat larger relative decreases in cap rates in good times and somewhat larger relative increases in cap rates in bad times. This may be a result of greater interest from investors and the larger markets’ higher liquidity, which could lead to slightly larger swings in property values as investors chase returns or flee adverse market conditions. By contrast, mid-sized office markets experience larger swings in transaction volumes but smaller changes in cap rates, suggesting that investors are less likely to bid up prices to the same degree when investment is booming. This difference could also suggest that a higher share of investment in mid-sized markets goes toward new development, increasing the supply of available space without bidding up the value of existing assets to the same degree as in larger, more land-constrained markets. Additional research would be needed to confirm either explanation. The difference in average cap rate volatility between larger and mid-sized office markets is smaller than the difference between larger and mid-sized industrial markets, which is discussed later in the report.
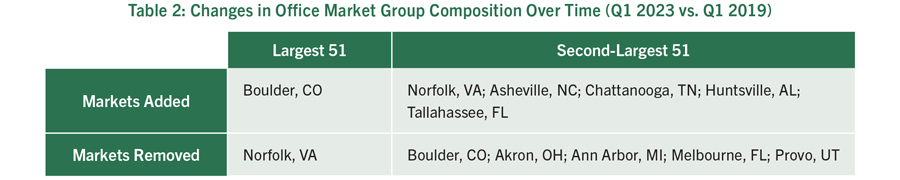
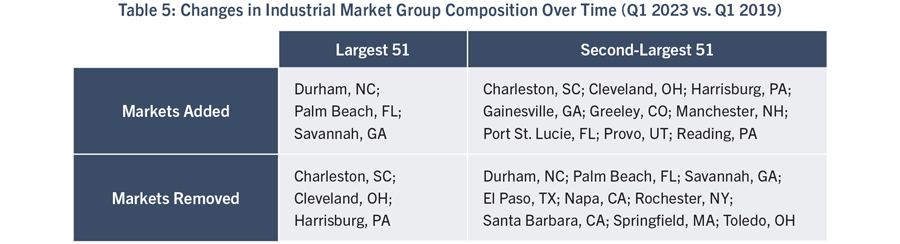
Also of note, between Q1 2019 and Q1 2023, Boulder, Colorado, joined the largest 51 office markets, and Norfolk, Virginia, dropped to the second-largest 51 (Table 2).
Mid-sized Office Markets
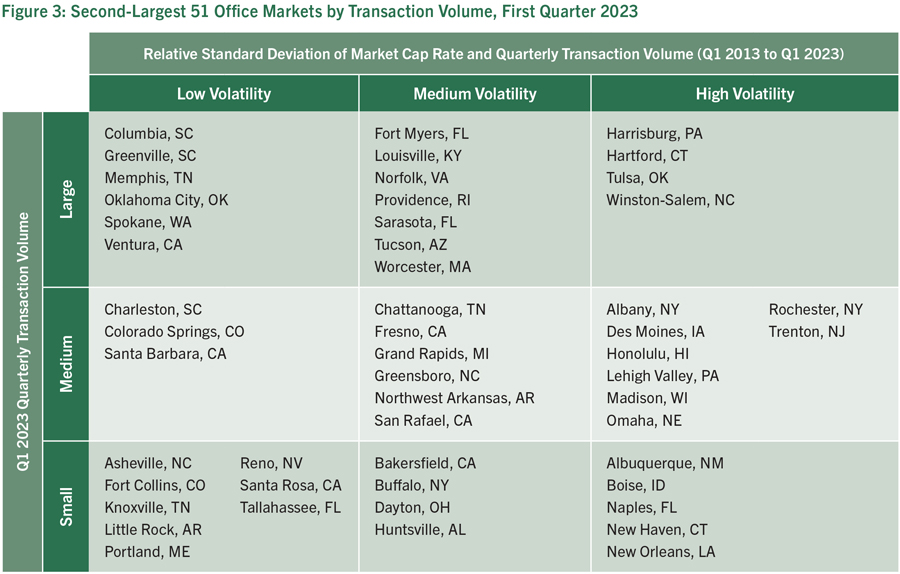
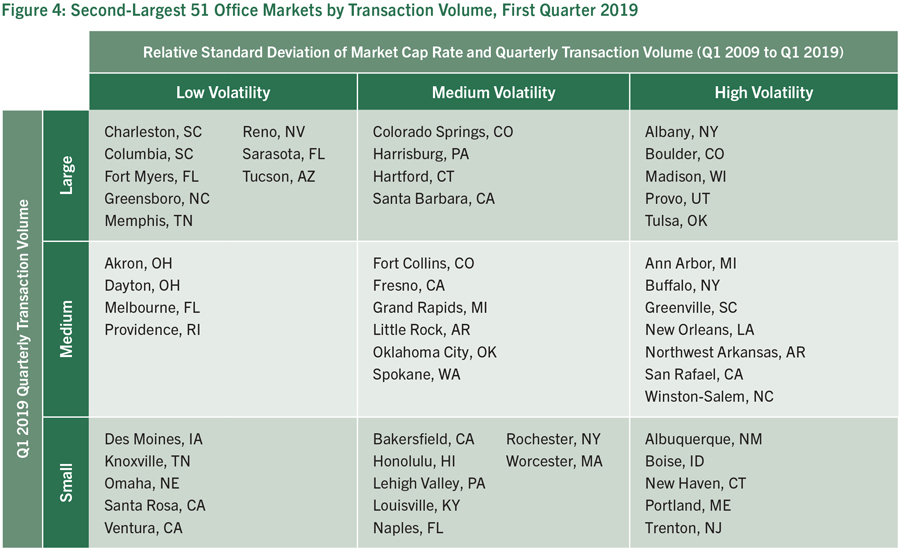
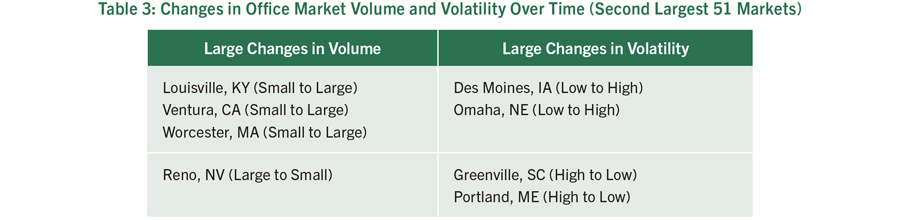
Similar to what the grids revealed in the largest 51 office markets, volatility also increased in several of the next 51 largest office markets. Among this group, many markets saw particularly large increases in volatility between Q1 2019 and Q1 2023, including Fort Myers and Sarasota in Florida; Tucson, Arizona; Harrisburg, Pennsylvania; and Hartford, Connecticut. Des Moines, Iowa, and Omaha, Nebraska, also experienced noticeably large volatility increases, starting off Q1 2019 in the least volatile third of markets and ending in the most volatile third of markets by Q1 2023. However, some markets moved in the other direction. Of particular note, Greenville, South Carolina, and Portland, Maine, experienced large decreases in volatility over the same time period.
There were also a few big movers in transaction volume between the years, including significant growth in Louisville, Kentucky; Worcester, Massachusetts; and Ventura, California. Reno, Nevada, on the other hand, experienced a contraction from the top third to the bottom third of markets.
Overall, the second-largest 51 office markets were slightly more likely to experience a relative change in transaction volume than the more stable largest 51 markets. However, it is also important to note that smaller markets can experience larger changes in relative transaction activity from one quarter to the next as individual transactions can have a more dramatic impact on total volume.
Consistent with the larger market trend of increased activity in the Sunbelt, all the markets added to the group are located in the South, and three of the four markets falling out of the group are located in the Midwest (see Table 2).
Industrial Markets
E-Commerce Behind Shifts in Industrial Markets
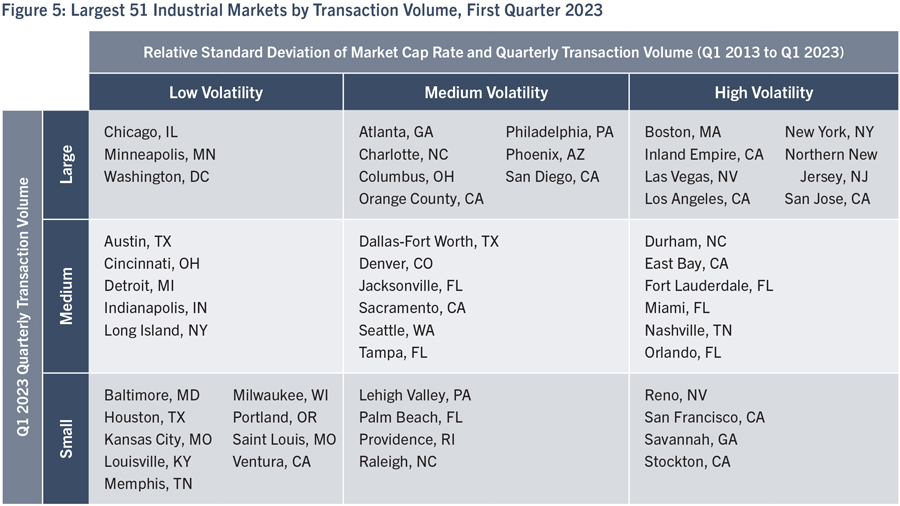
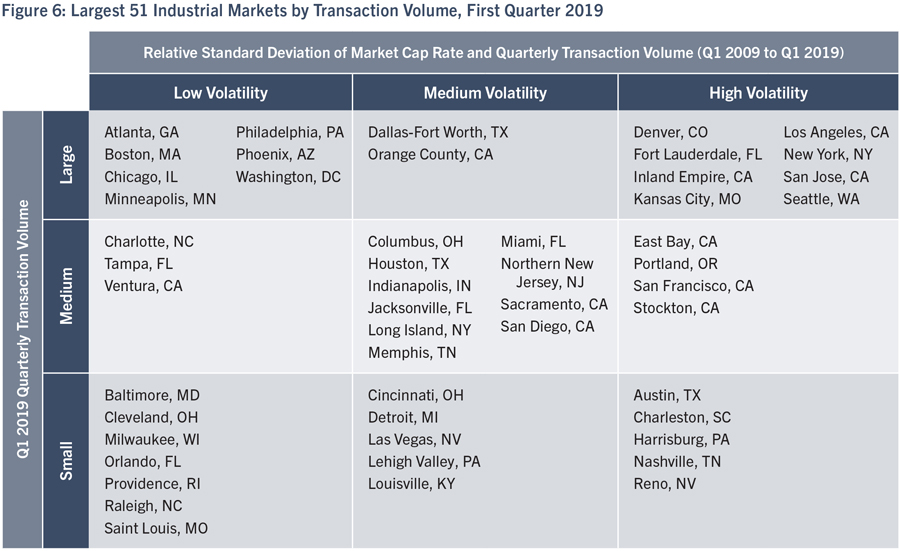
The grids reflect e-commerce’s continued positive impact on industrial markets. In contrast to the office markets, the largest industrial markets were more likely to experience increased transaction activity between Q1 2019 and Q1 2023, with fewer notable changes in volatility. Among the markets that saw sharp transaction volume increases are Orlando, Northern New Jersey and Las Vegas. The wide geographic differences among these three markets illustrate the nationwide demand for e-commerce. Las Vegas has also absorbed some of the eastward movement of industrial occupiers resulting from land scarcity and regulatory constraints on new development in Los Angeles and neighboring markets.
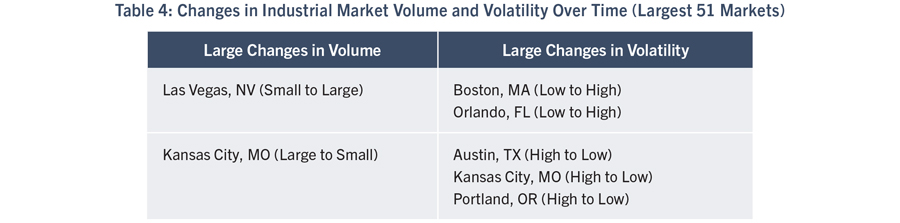
Kansas City is also notable for its transaction volume moving in the opposite direction. In the first quarter of 2019, it was in the top third of the largest 51 industrial markets by transaction volume. However, it dropped down to the bottom third of this group in the first quarter of 2023 while also seeing an accompanying decrease in volatility. This is likely due to further consolidation of railway companies and the completion of the development of available land adjacent to the BNSF intermodal facility in Kansas City, which resulted in a downturn and eventual stabilization of activity in the market.
Three markets showed large changes in grid positions with respect to volatility: Boston went from low to high, while Austin, Texas, and Portland, Oregon, went from high to low. This may be the result of market stabilization in Austin and Portland, and a more variable range of pricing for Boston transactions.
On average, the 51 largest industrial markets in Q1 2023 experienced 30 percent higher volatility in cap rates and 22 percent lower volatility in transaction volumes compared to the second-largest 51 markets in the same quarter. This pattern is similar to the one observed for the largest and second-largest office markets, but the difference in volatility between large and mid-sized industrial markets is notably higher (30 percent vs. 10 percent). As with office markets, larger industrial markets attract more investors, which explains their greater liquidity, and may also partially explain greater cap rate compression and expansion during periods of economic expansion and contraction. Land scarcity in larger markets may also explain the larger difference in cap rate volatility when compared with the office sector. Since industrial projects are generally built on larger lots than office projects, less frequently involve redevelopment, and face functional limits to their vertical development, land scarcity limits the supply of new space to a greater extent. Capital flows into or out of land scarce industrial markets thus may affect cap rates to a greater extent than for land scarce office markets, where new space delivered through redevelopment and new development on smaller lots may act to limit cap rate compression. As noted earlier, the limited supply of land in the largest industrial markets is contributing to additional development in smaller industrial markets where land is more abundant. That new development can contribute to greater transaction volume volatility, but the supply of additional space also limits cap rate compression for existing assets, contributing to greater price stability.
Markets joining the largest 51 industrial markets in the first quarter of 2023 include Durham, North Carolina; Palm Beach, Florida; and Savannah, Georgia. Savannah’s growth is particularly interesting, as its rise into the largest 51 markets is an indication of its growing significance as a port city. Savannah’s location, including its proximity to Atlanta and to major rail lines and interstates, gives it a strategic position to serve 45 percent of the U.S. population.
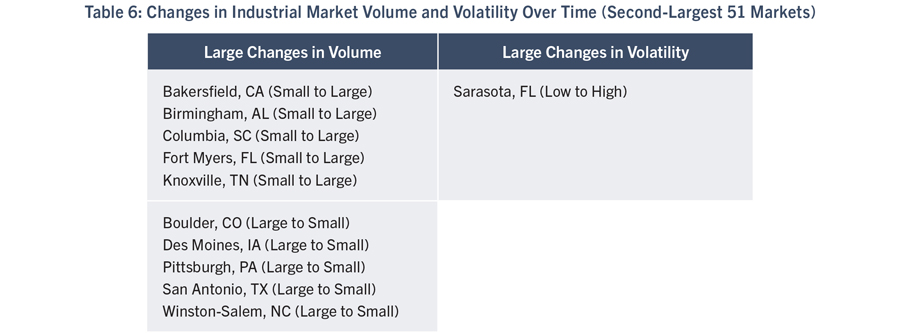
These three market additions replaced Charleston, South Carolina; Cleveland, Ohio; and Harrisburg, Pennsylvania, which between the first quarters of 2019 and 2023 dropped out of the top 51 into the next-largest 51 industrial markets (see Table 5).
Mid-Sized Industrial Markets
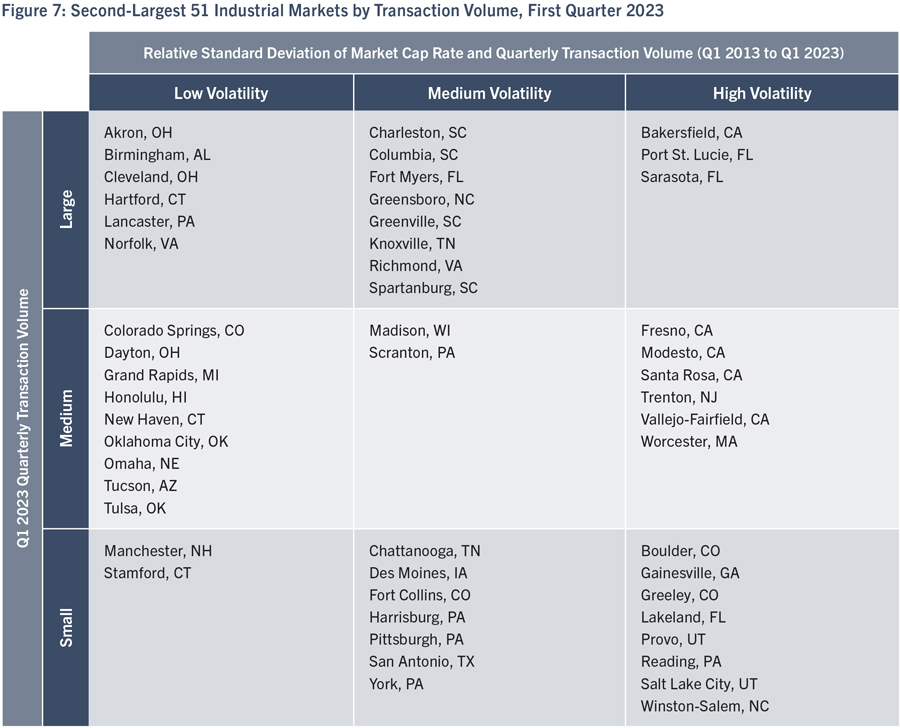
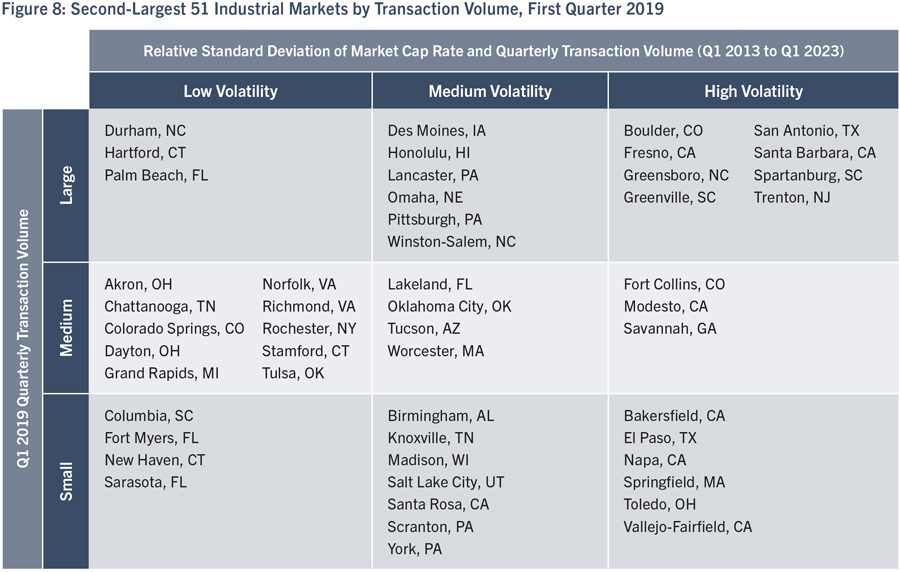
While smaller industrial markets in the Midwest experienced a decrease in transaction volume, several Southern industrial markets grew in transaction volume – most notably those in Florida, Virginia and Alabama. This regional activity is consistent with the demographic and business shifts impacting the office markets.
California also has several growing markets. In particular, Bakersfield, California, exhibited some positive momentum, as development moved inland due to a lack of development opportunities in Los Angeles. This movement is part of the same trend that supported growing transaction volumes in larger inland markets like Las Vegas.
Many smaller markets, including El Paso, Texas; Napa, California; Rochester, New York; Santa Barbara, California; Springfield, Massachusetts; and Toledo, Ohio, dropped out of the second-largest set of 51 industrial markets altogether between the first quarters of 2019 and 2023 (see Table 5). This could be due to several factors including supply chain issues, local market challenges during the pandemic, or diminishing availability of developable land.

Several markets joined the second-largest 51 industrial markets from various parts of the country. These include: Gainesville, Georgia; Greeley, Colorado; Manchester, New Hampshire; Port St. Lucie, Florida; Provo, Utah; and Reading, Pennsylvania. All these markets are located near larger metropolitan areas (Atlanta, Boston, Miami, Salt Lake City, Philadelphia), and their growth likely reflects investments to support e-commerce.
Conclusion
The effects of the COVID-19 pandemic, from increased uncertainty around office space to e-commerce growth reshaping industrial, continue to be felt in both the office and industrial markets. In the office markets, particularly in large urban markets and those where technology firms drive leasing activity, workers have not returned full-time to their desks. These changes have resulted in significant volatility among office markets, as revealed in this analysis. The pandemic’s impact will likely be reflected in transaction volume and property valuations for several more quarters, but it remains to be seen which changes are temporary and which are enduring. The NAIOP Market Monitor also confirms the acceleration of trends that predate the pandemic, such as demographic shifts that have favored Sunbelt markets.
The two-dimensional grids can also show markets in a region or that share common characteristics moving together as a group. Analyzing the real estate data in this manner quickly confirms that the Sunbelt markets are growing in size as measured by transaction volume. From there, the user can further segment these markets by size and volatility. Another example is seeing that several tech-centric office markets are now smaller when measured by transaction volume. Additional research would be needed to explain the factors contributing to the changes (such as long-term demographic or economic trends or more short-term patterns of transaction activity linked to a major event).
Looking behind the volatility trends represented in the NAIOP Market Monitor reveals that the largest office and industrial markets experience lower transaction volume volatility but higher cap rate volatility than mid-sized markets. Investors and developers with shorter investment horizons may be attracted to larger markets for the greater liquidity they provide and their greater potential for cap rate compression when business conditions are favorable. However, these markets’ higher cap rate volatility also presents downside risks, as recently revealed in many large office markets. Investors with longer time horizons may look to mid-sized markets, which generally offer lower cap rate volatility and higher yields, for a better risk-adjusted return. The NAIOP Market Monitor can help both groups identify markets that align with their investment objectives and risk tolerance.
The NAIOP Market Monitor, which will be published yearly, will be useful for showing how markets continue to evolve, and for guiding strategic conversations for a wide range of developers, investors, service providers and academics.
About NAIOP
NAIOP, the Commercial Real Estate Development Association, is the leading organization for developers, owners and related professionals in office, industrial, retail and mixed-use real estate. NAIOP comprises some 20,000 members in North America. NAIOP advances responsible commercial real estate development and advocates for effective public policy. For more information, visit naiop.org.
The NAIOP Research Foundation was established in 2000 as a 501(c)(3) organization to support the work of individuals and organizations engaged in real estate development, investment and operations. The Foundation’s core purpose is to provide information about how real properties, especially office, industrial and mixed-use properties, impact and benefit communities throughout North America. The initial funding for the Research Foundation was underwritten by NAIOP and its Founding Governors with an endowment established to support future research. For more information, visit naiop.org/researchfoundation.
About the Authors
Maria Sicola and Megan Weiner are partners of Heybrook West, an urban planning consultancy that uses the newest data technologies and analytics to support decision making and facilitate public discussion. Charles Warren is senior quantitative lead for the Real Estate Analysis and Value Capture practice at WSP, focusing on leveraging transit-oriented development to increase funding for transit infrastructure. Sicola holds an MBA from Manhattan College, an MS in Information Science from Rutgers University and a BA from Seton Hall University; additionally, she completed post-graduate studies in statistics and experimental design at Purdue University. Weiner holds an MBA from NYU’s Stern School of Business and an Economics BA from NYU’s College of Arts and Sciences. Warren holds a PhD in City and Regional Planning from the University of California Berkeley and an MA in Urban Studies from the John W. Draper Interdisciplinary Program at New York University.
Media Inquiries
Please contact Kathryn Hamilton, vice president for marketing and communications, at hamilton@naiop.org.
Disclaimer
This project is intended to provide information and insights to industry practitioners and does not constitute advice or recommendations. NAIOP disclaims any liability for actions taken as a result of this project and its findings.
© 2023 NAIOP Research Foundation
Endnotes
1 CBRE, “Office Buildings Hardest Hit by Pandemic Share Common Characteristics,” April 4, 2023, https://www.cbre.com/insights/viewpoints/office-buildings-hardest-hit-by-pandemic-share-common-characteristics.